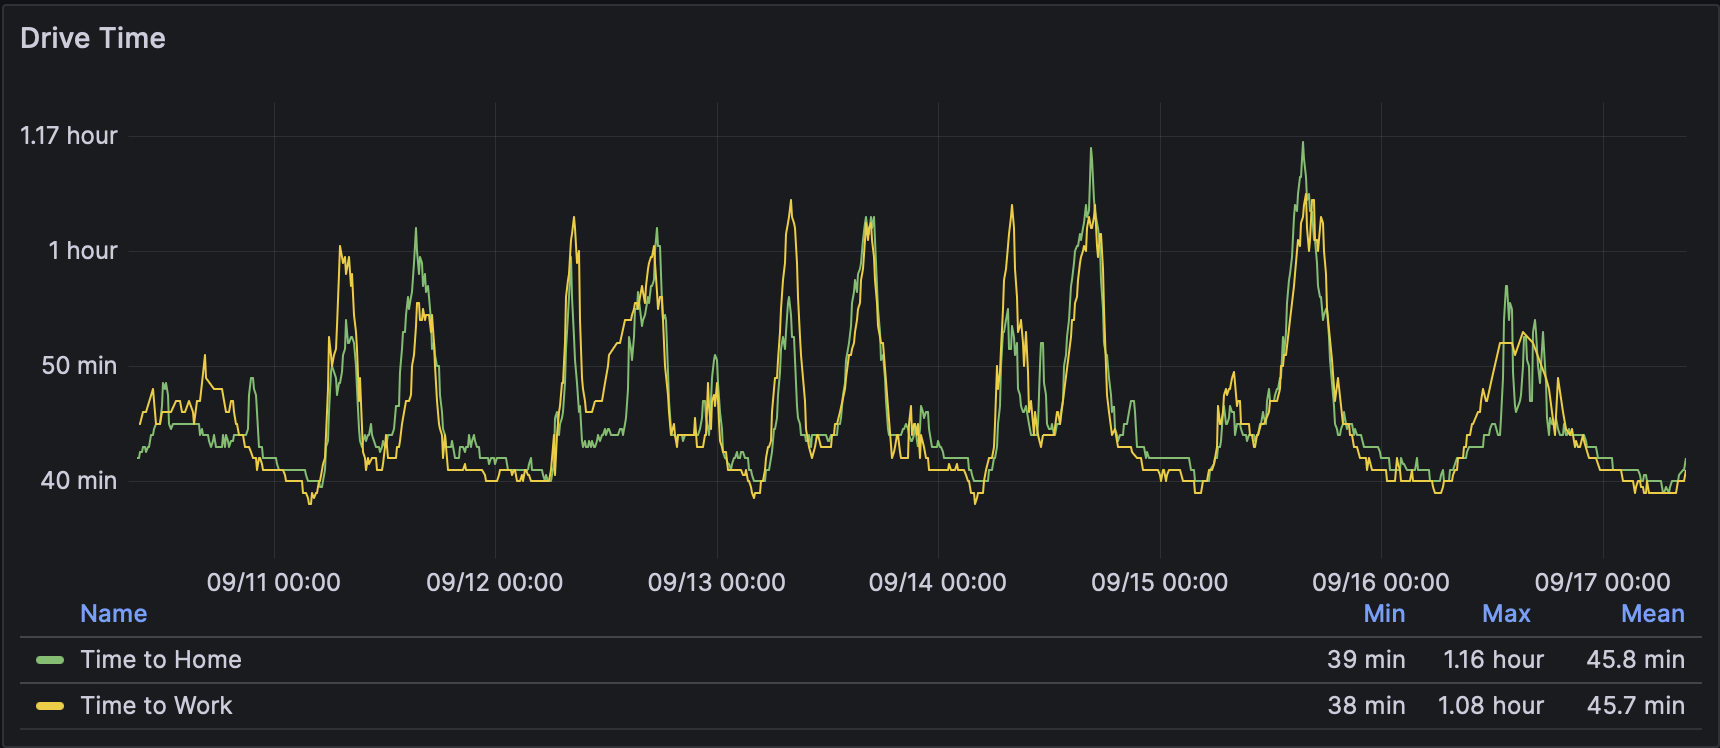
Ever since changing jobs and increasing my commute from 20-30 minutes to 60-90 minutes I’ve been searching for the best time to leave to minimize my time in traffic.
I started out with using the Waze integration in Home Assistant to log the drive time according to Waze to and from work throughout the day:

This was then logged into InfluxDB and graphed with Grafana. However this only really gave me an idea of when the best time to leave was, not the best route to take. What I really wanted to see was how the traffic patterns changed over time because it often seemed that when I left there was almost no traffic and by the time I got halfway to work there was a lot of traffic.
Capturing the Screenshots
So from that I got the idea to try to make a timelapse of the traffic along the route. A quick Google search turned up this article from Browserless which was pretty much exactly what I wanted to do: https://www.browserless.io/blog/2022/08/03/how-to-create-time-lapse-traffic/
However that was all Javascript and based on using their browser testing service so I decided to see if there was an easier way to do it locally. Basically what I wanted was to just setup a cron job that ran at a certain interval to save a screenshot of Google Maps with the traffic layer turned on.
After some more research I found that Selenium is available for Python and had the ability to load a page in a windowless environment and then save a screenshot of the webpage.
I’ve posted the Python script I wrote to handle the screenshots here: https://gist.github.com/KalenXI/4dcfb8df5f72f052b241930459e33b0f
Basically it uses Selenium to load up Chrome in a windowless environment, load the Google Maps page, waits 5 seconds for the page to finish loading, runs some Javascript to hide parts of the Google Maps UI that I don’t want in the screenshot and adds a timestamp. Then saves a screenshot of the page to a PNG file.
I then set this up as a cron job that runs every minute to take a screenshot of the current traffic. Afterwards you’ll end up with a folder full of PNGs with the Unix timestamp.
Converting to Video
To make this into a video I wrote a shell script that uses ffmpeg to convert the PNG image sequence into an MP4 video, then deletes all of the source images. And I have that shell script set to run every night at midnight via another cron job.
|
|
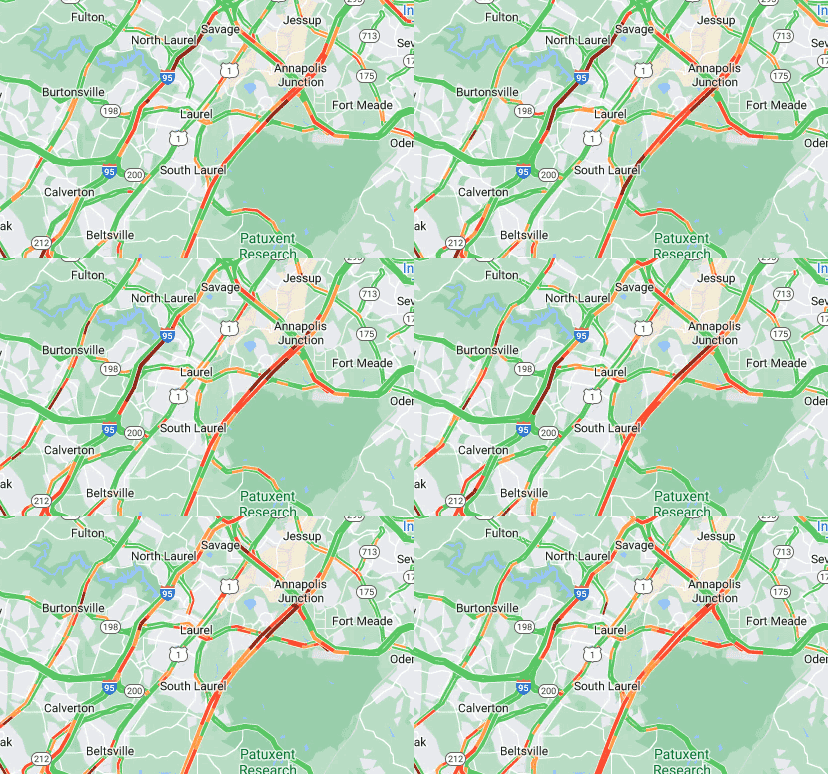
So every night at midnight I end up with a MP4 file showing the traffic from the previous day like this:
Analysis
What’s especially interesting is that you can actually see the traffic waves as they propagate backwards from the direction of traffic.

And you can also see the effect of heavy storms as they pass through.
